First off, I’m not entirely sure this is a bug or an intended behaviour (for a reason I might be overlooking), but it’s been bothering me enough to warrant a bug report. Please let me know if I’m missing something!
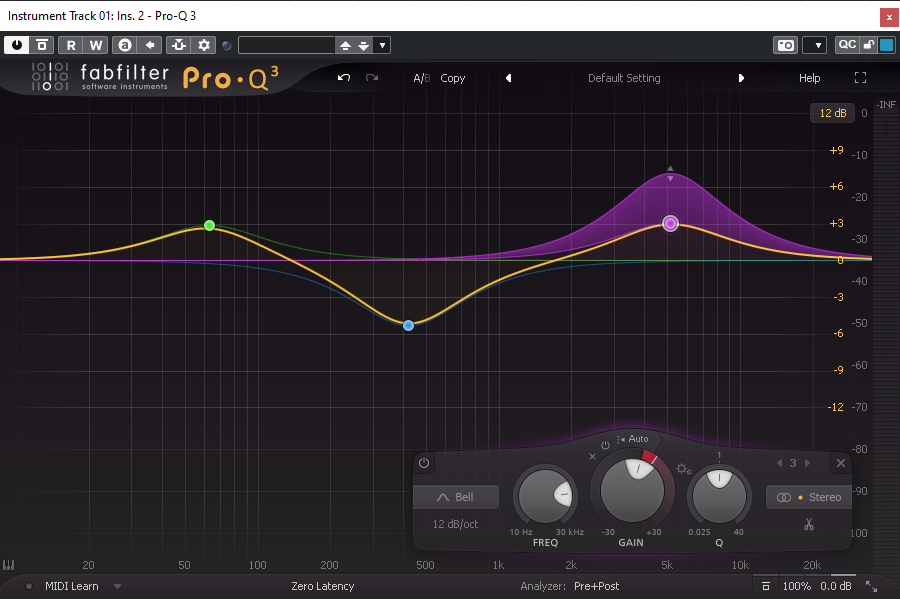
In Frequency 2, when all bands are static (dynamic mode is off), the pale green line in the spectrum analyzer reflects the combined curve of all EQ bands, as intended (as shown in the screenshot labeled “Static EQ”). Once you switch one or more bands to dynamic mode, the pale green line stays flat at 0 dB, only showing movements related to dynamics (as shown in the screenshot labeled “Dynamic EQ”). This makes it difficult to visualize how static and dynamic EQ band changes affect the overall EQ curve. Pro-Q does this correctly, though with a yellow line instead of pale green line (as shown in the screenshot labeled “Pro-Q 3”).
I know the bug is widespread since it is shown in Steinberg’s own demo video. Notice how the pale green line is flat despite all the static EQ bands. You can even see the pale green line flickering between where it should be and 0 dB when Dom is dragging the static EQ band at 3:42, which leads me to further believe that it is a graphical bug.


Details:
Windows 10 Pro 21H2
Cubase 12.0.50 Pro
Frequency 2 12.5.20.68
CPU: AMD Ryzen 5 5600X
RAM: 64 GB DDR4 3200 MHz
GPU: NVIDIA GeForce RTX 3080 10 GB
Audio Interface: SSL 2+