This is what I got
CONCLUSION
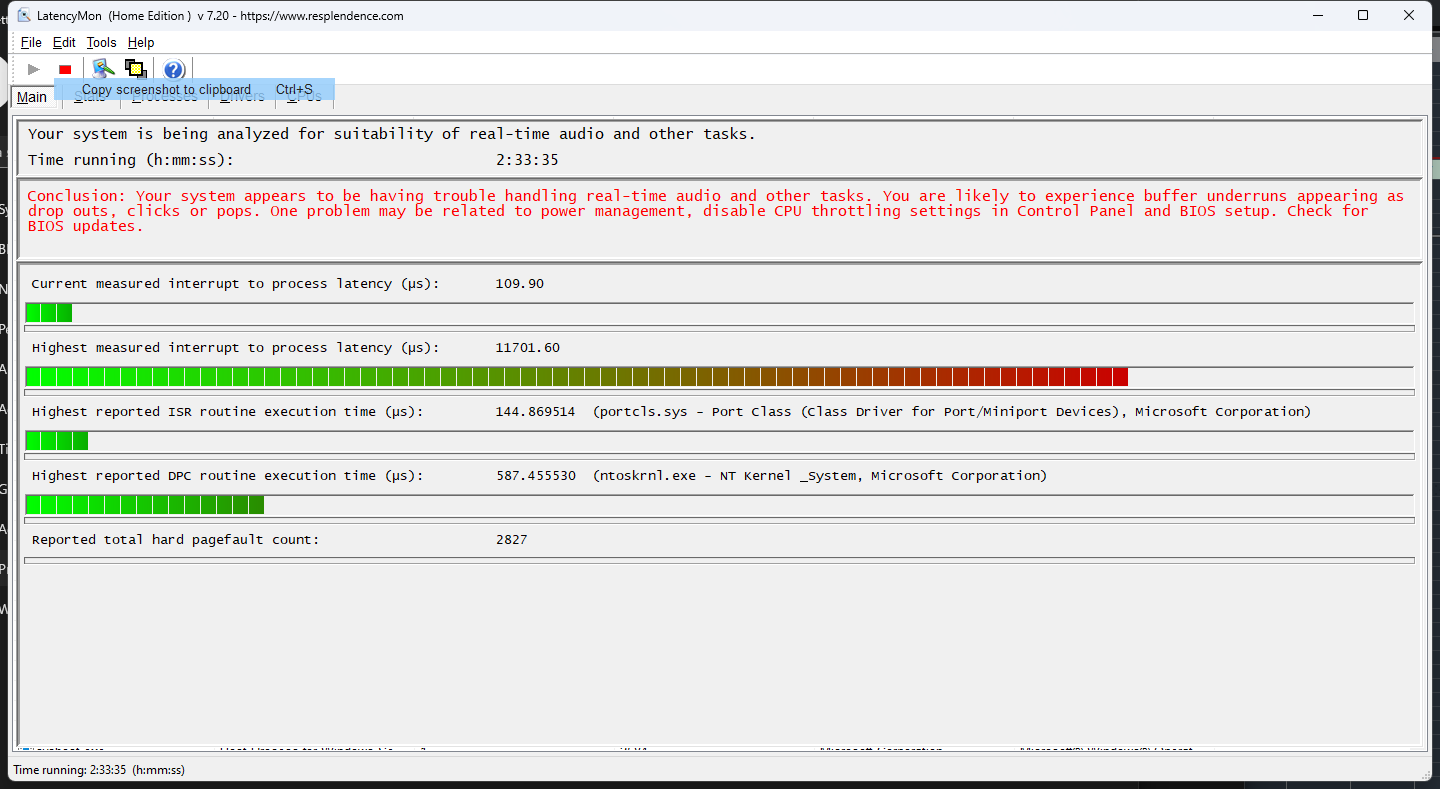
Your system appears to be having trouble handling real-time audio and other tasks. You are likely to experience buffer underruns appearing as drop outs, clicks or pops. One problem may be related to power management, disable CPU throttling settings in Control Panel and BIOS setup. Check for BIOS updates.
LatencyMon has been analyzing your system for 0:27:05 (h:mm:ss) on all processors.
SYSTEM INFORMATION
Computer name: PROSTUDIO
OS version: Windows 11, 10.0, version 2009, build: 22621 (x64)
Hardware: Z690 UD AX DDR4, Gigabyte Technology Co., Ltd.
BIOS: F7b
CPU: GenuineIntel 12th Gen Intel(R) Core™ i9-12900KS
Logical processors: 24
Processor groups: 1
Processor group size: 24
RAM: 130942 MB total
CPU SPEED
Reported CPU speed (WMI): 340 MHz
Reported CPU speed (registry): 3418 MHz
Note: reported execution times may be calculated based on a fixed reported CPU speed. Disable variable speed settings like Intel Speed Step and AMD Cool N Quiet in the BIOS setup for more accurate results.
MEASURED INTERRUPT TO USER PROCESS LATENCIES
The interrupt to process latency reflects the measured interval that a usermode process needed to respond to a hardware request from the moment the interrupt service routine started execution. This includes the scheduling and execution of a DPC routine, the signaling of an event and the waking up of a usermode thread from an idle wait state in response to that event.
Highest measured interrupt to process latency (µs): 4038.70
Average measured interrupt to process latency (µs): 7.272478
Highest measured interrupt to DPC latency (µs): 336.70
Average measured interrupt to DPC latency (µs): 3.940451
REPORTED ISRs
Interrupt service routines are routines installed by the OS and device drivers that execute in response to a hardware interrupt signal.
Highest ISR routine execution time (µs): 144.869514
Driver with highest ISR routine execution time: portcls.sys - Port Class (Class Driver for Port/Miniport Devices), Microsoft Corporation
Highest reported total ISR routine time (%): 0.002496
Driver with highest ISR total time: portcls.sys - Port Class (Class Driver for Port/Miniport Devices), Microsoft Corporation
Total time spent in ISRs (%) 0.003918
ISR count (execution time <250 µs): 1000613
ISR count (execution time 250-500 µs): 0
ISR count (execution time 500-1000 µs): 0
ISR count (execution time 1000-2000 µs): 0
ISR count (execution time 2000-4000 µs): 0
ISR count (execution time >=4000 µs): 0
REPORTED DPCs
DPC routines are part of the interrupt servicing dispatch mechanism and disable the possibility for a process to utilize the CPU while it is interrupted until the DPC has finished execution.
Highest DPC routine execution time (µs): 554.192218
Driver with highest DPC routine execution time: ntoskrnl.exe - NT Kernel & System, Microsoft Corporation
Highest reported total DPC routine time (%): 0.017752
Driver with highest DPC total execution time: Wdf01000.sys - Kernel Mode Driver Framework Runtime, Microsoft Corporation
Total time spent in DPCs (%) 0.045783
DPC count (execution time <250 µs): 2906573
DPC count (execution time 250-500 µs): 0
DPC count (execution time 500-10000 µs): 28
DPC count (execution time 1000-2000 µs): 0
DPC count (execution time 2000-4000 µs): 0
DPC count (execution time >=4000 µs): 0
REPORTED HARD PAGEFAULTS
Hard pagefaults are events that get triggered by making use of virtual memory that is not resident in RAM but backed by a memory mapped file on disk. The process of resolving the hard pagefault requires reading in the memory from disk while the process is interrupted and blocked from execution.
NOTE: some processes were hit by hard pagefaults. If these were programs producing audio, they are likely to interrupt the audio stream resulting in dropouts, clicks and pops. Check the Processes tab to see which programs were hit.
Process with highest pagefault count: chrome.exe
Total number of hard pagefaults 1971
Hard pagefault count of hardest hit process: 946
Number of processes hit: 37
PER CPU DATA
CPU 0 Interrupt cycle time (s): 20.966198
CPU 0 ISR highest execution time (µs): 18.987420
CPU 0 ISR total execution time (s): 0.106639
CPU 0 ISR count: 32364
CPU 0 DPC highest execution time (µs): 444.737273
CPU 0 DPC total execution time (s): 1.541644
CPU 0 DPC count: 443767
CPU 1 Interrupt cycle time (s): 9.453329
CPU 1 ISR highest execution time (µs): 144.869514
CPU 1 ISR total execution time (s): 0.142874
CPU 1 ISR count: 86280
CPU 1 DPC highest execution time (µs): 210.848449
CPU 1 DPC total execution time (s): 1.741645
CPU 1 DPC count: 239546
CPU 2 Interrupt cycle time (s): 18.494218
CPU 2 ISR highest execution time (µs): 69.671738
CPU 2 ISR total execution time (s): 0.330621
CPU 2 ISR count: 195467
CPU 2 DPC highest execution time (µs): 371.507607
CPU 2 DPC total execution time (s): 3.913555
CPU 2 DPC count: 577442
CPU 3 Interrupt cycle time (s): 3.414763
CPU 3 ISR highest execution time (µs): 11.185489
CPU 3 ISR total execution time (s): 0.010333
CPU 3 ISR count: 2769
CPU 3 DPC highest execution time (µs): 83.516384
CPU 3 DPC total execution time (s): 0.059820
CPU 3 DPC count: 11680
CPU 4 Interrupt cycle time (s): 6.985258
CPU 4 ISR highest execution time (µs): 11.803394
CPU 4 ISR total execution time (s): 0.023524
CPU 4 ISR count: 6547
CPU 4 DPC highest execution time (µs): 108.306905
CPU 4 DPC total execution time (s): 0.237648
CPU 4 DPC count: 50439
CPU 5 Interrupt cycle time (s): 6.365079
CPU 5 ISR highest execution time (µs): 84.362785
CPU 5 ISR total execution time (s): 0.112810
CPU 5 ISR count: 68187
CPU 5 DPC highest execution time (µs): 266.066121
CPU 5 DPC total execution time (s): 1.259491
CPU 5 DPC count: 186520
CPU 6 Interrupt cycle time (s): 15.614715
CPU 6 ISR highest execution time (µs): 76.147747
CPU 6 ISR total execution time (s): 0.296555
CPU 6 ISR count: 180403
CPU 6 DPC highest execution time (µs): 554.192218
CPU 6 DPC total execution time (s): 3.477115
CPU 6 DPC count: 513203
CPU 7 Interrupt cycle time (s): 3.334527
CPU 7 ISR highest execution time (µs): 11.985957
CPU 7 ISR total execution time (s): 0.014879
CPU 7 ISR count: 4088
CPU 7 DPC highest execution time (µs): 120.825044
CPU 7 DPC total execution time (s): 0.082879
CPU 7 DPC count: 16531
CPU 8 Interrupt cycle time (s): 7.903901
CPU 8 ISR highest execution time (µs): 10.717964
CPU 8 ISR total execution time (s): 0.021307
CPU 8 ISR count: 5954
CPU 8 DPC highest execution time (µs): 106.566706
CPU 8 DPC total execution time (s): 0.232986
CPU 8 DPC count: 46770
CPU 9 Interrupt cycle time (s): 5.963575
CPU 9 ISR highest execution time (µs): 67.285547
CPU 9 ISR total execution time (s): 0.088501
CPU 9 ISR count: 53816
CPU 9 DPC highest execution time (µs): 185.254535
CPU 9 DPC total execution time (s): 0.960129
CPU 9 DPC count: 146077
CPU 10 Interrupt cycle time (s): 14.405020
CPU 10 ISR highest execution time (µs): 60.136922
CPU 10 ISR total execution time (s): 0.202639
CPU 10 ISR count: 122995
CPU 10 DPC highest execution time (µs): 228.617028
CPU 10 DPC total execution time (s): 2.288665
CPU 10 DPC count: 357484
CPU 11 Interrupt cycle time (s): 3.559447
CPU 11 ISR highest execution time (µs): 8.867466
CPU 11 ISR total execution time (s): 0.003105
CPU 11 ISR count: 839
CPU 11 DPC highest execution time (µs): 139.175834
CPU 11 DPC total execution time (s): 0.047785
CPU 11 DPC count: 9926
CPU 12 Interrupt cycle time (s): 8.320805
CPU 12 ISR highest execution time (µs): 16.906671
CPU 12 ISR total execution time (s): 0.007875
CPU 12 ISR count: 2180
CPU 12 DPC highest execution time (µs): 146.697191
CPU 12 DPC total execution time (s): 0.284188
CPU 12 DPC count: 48740
CPU 13 Interrupt cycle time (s): 3.784552
CPU 13 ISR highest execution time (µs): 46.969573
CPU 13 ISR total execution time (s): 0.017296
CPU 13 ISR count: 10372
CPU 13 DPC highest execution time (µs): 134.976594
CPU 13 DPC total execution time (s): 0.192594
CPU 13 DPC count: 29674
CPU 14 Interrupt cycle time (s): 12.361796
CPU 14 ISR highest execution time (µs): 70.838209
CPU 14 ISR total execution time (s): 0.105094
CPU 14 ISR count: 63347
CPU 14 DPC highest execution time (µs): 550.40550
CPU 14 DPC total execution time (s): 1.391098
CPU 14 DPC count: 208315
CPU 15 Interrupt cycle time (s): 3.139204
CPU 15 ISR highest execution time (µs): 0.0
CPU 15 ISR total execution time (s): 0.0
CPU 15 ISR count: 0
CPU 15 DPC highest execution time (µs): 95.351668
CPU 15 DPC total execution time (s): 0.023807
CPU 15 DPC count: 3299
CPU 16 Interrupt cycle time (s): 3.045059
CPU 16 ISR highest execution time (µs): 0.0
CPU 16 ISR total execution time (s): 0.0
CPU 16 ISR count: 0
CPU 16 DPC highest execution time (µs): 136.764775
CPU 16 DPC total execution time (s): 0.011547
CPU 16 DPC count: 1849
CPU 17 Interrupt cycle time (s): 2.904373
CPU 17 ISR highest execution time (µs): 0.0
CPU 17 ISR total execution time (s): 0.0
CPU 17 ISR count: 0
CPU 17 DPC highest execution time (µs): 107.897016
CPU 17 DPC total execution time (s): 0.006996
CPU 17 DPC count: 998
CPU 18 Interrupt cycle time (s): 2.864538
CPU 18 ISR highest execution time (µs): 0.0
CPU 18 ISR total execution time (s): 0.0
CPU 18 ISR count: 0
CPU 18 DPC highest execution time (µs): 99.299883
CPU 18 DPC total execution time (s): 0.006624
CPU 18 DPC count: 903
CPU 19 Interrupt cycle time (s): 2.811403
CPU 19 ISR highest execution time (µs): 0.0
CPU 19 ISR total execution time (s): 0.0
CPU 19 ISR count: 0
CPU 19 DPC highest execution time (µs): 120.940316
CPU 19 DPC total execution time (s): 0.007345
CPU 19 DPC count: 1017
CPU 20 Interrupt cycle time (s): 3.113126
CPU 20 ISR highest execution time (µs): 0.0
CPU 20 ISR total execution time (s): 0.0
CPU 20 ISR count: 0
CPU 20 DPC highest execution time (µs): 139.832651
CPU 20 DPC total execution time (s): 0.015811
CPU 20 DPC count: 2191
CPU 21 Interrupt cycle time (s): 3.714634
CPU 21 ISR highest execution time (µs): 5.313049
CPU 21 ISR total execution time (s): 0.044196
CPU 21 ISR count: 165005
CPU 21 DPC highest execution time (µs): 129.979520
CPU 21 DPC total execution time (s): 0.053817
CPU 21 DPC count: 8054
CPU 22 Interrupt cycle time (s): 3.000733
CPU 22 ISR highest execution time (µs): 0.0
CPU 22 ISR total execution time (s): 0.0
CPU 22 ISR count: 0
CPU 22 DPC highest execution time (µs): 143.762142
CPU 22 DPC total execution time (s): 0.012046
CPU 22 DPC count: 1301
CPU 23 Interrupt cycle time (s): 3.027029
CPU 23 ISR highest execution time (µs): 0.0
CPU 23 ISR total execution time (s): 0.0
CPU 23 ISR count: 0
CPU 23 DPC highest execution time (µs): 128.375951
CPU 23 DPC total execution time (s): 0.007373
CPU 23 DPC count: 875