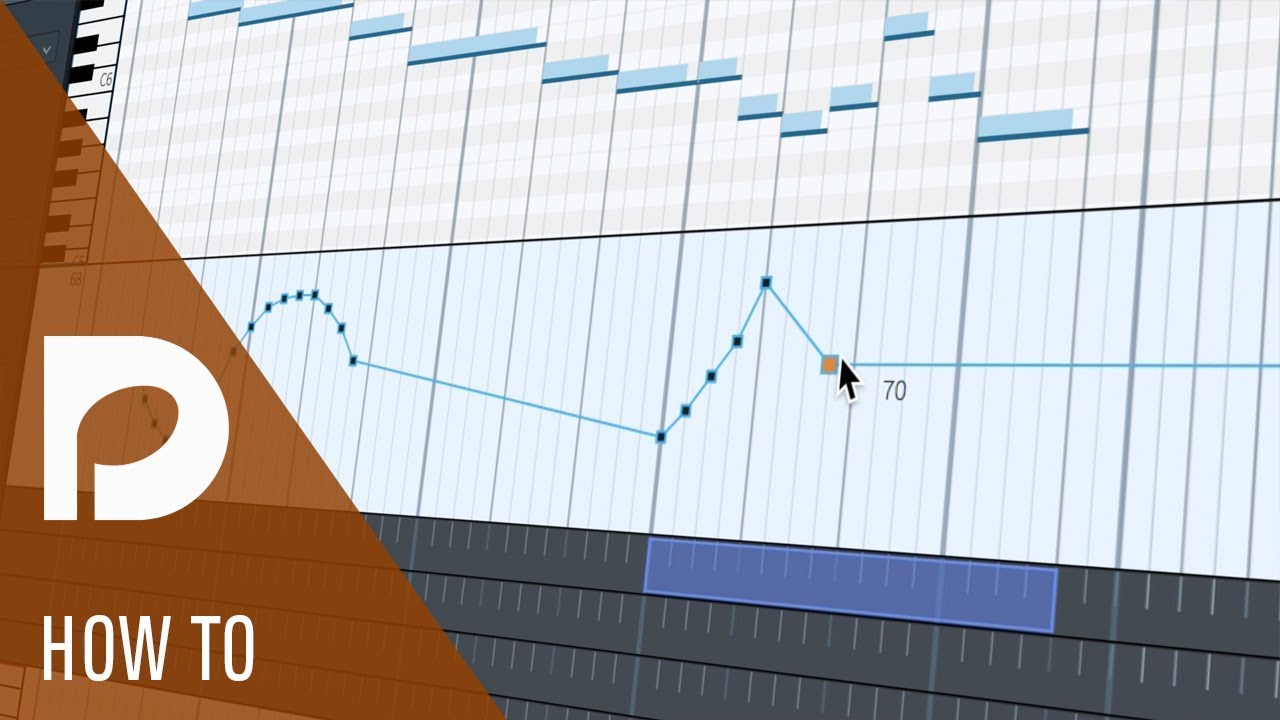
I’m struggling with the graphical representation of tempo changes.
As far as I remember, it used to be possible to drag the tempo-change line and see the graphical curve/representation, so that it could be adjusted and corrected later.
However, when I drag the line now, I only see a Signpost showing by what percentage the tempo has changed, but there is no graphical representation of the tempo curve.
Why is this? Is it a bug, or am I doing something wrong?
As I remember from Antony’s online tutorials, both of them were represented with graphical feedback that could be edited directly. This is something new to me.
Does anyone have any other ideas about what might be causing this?