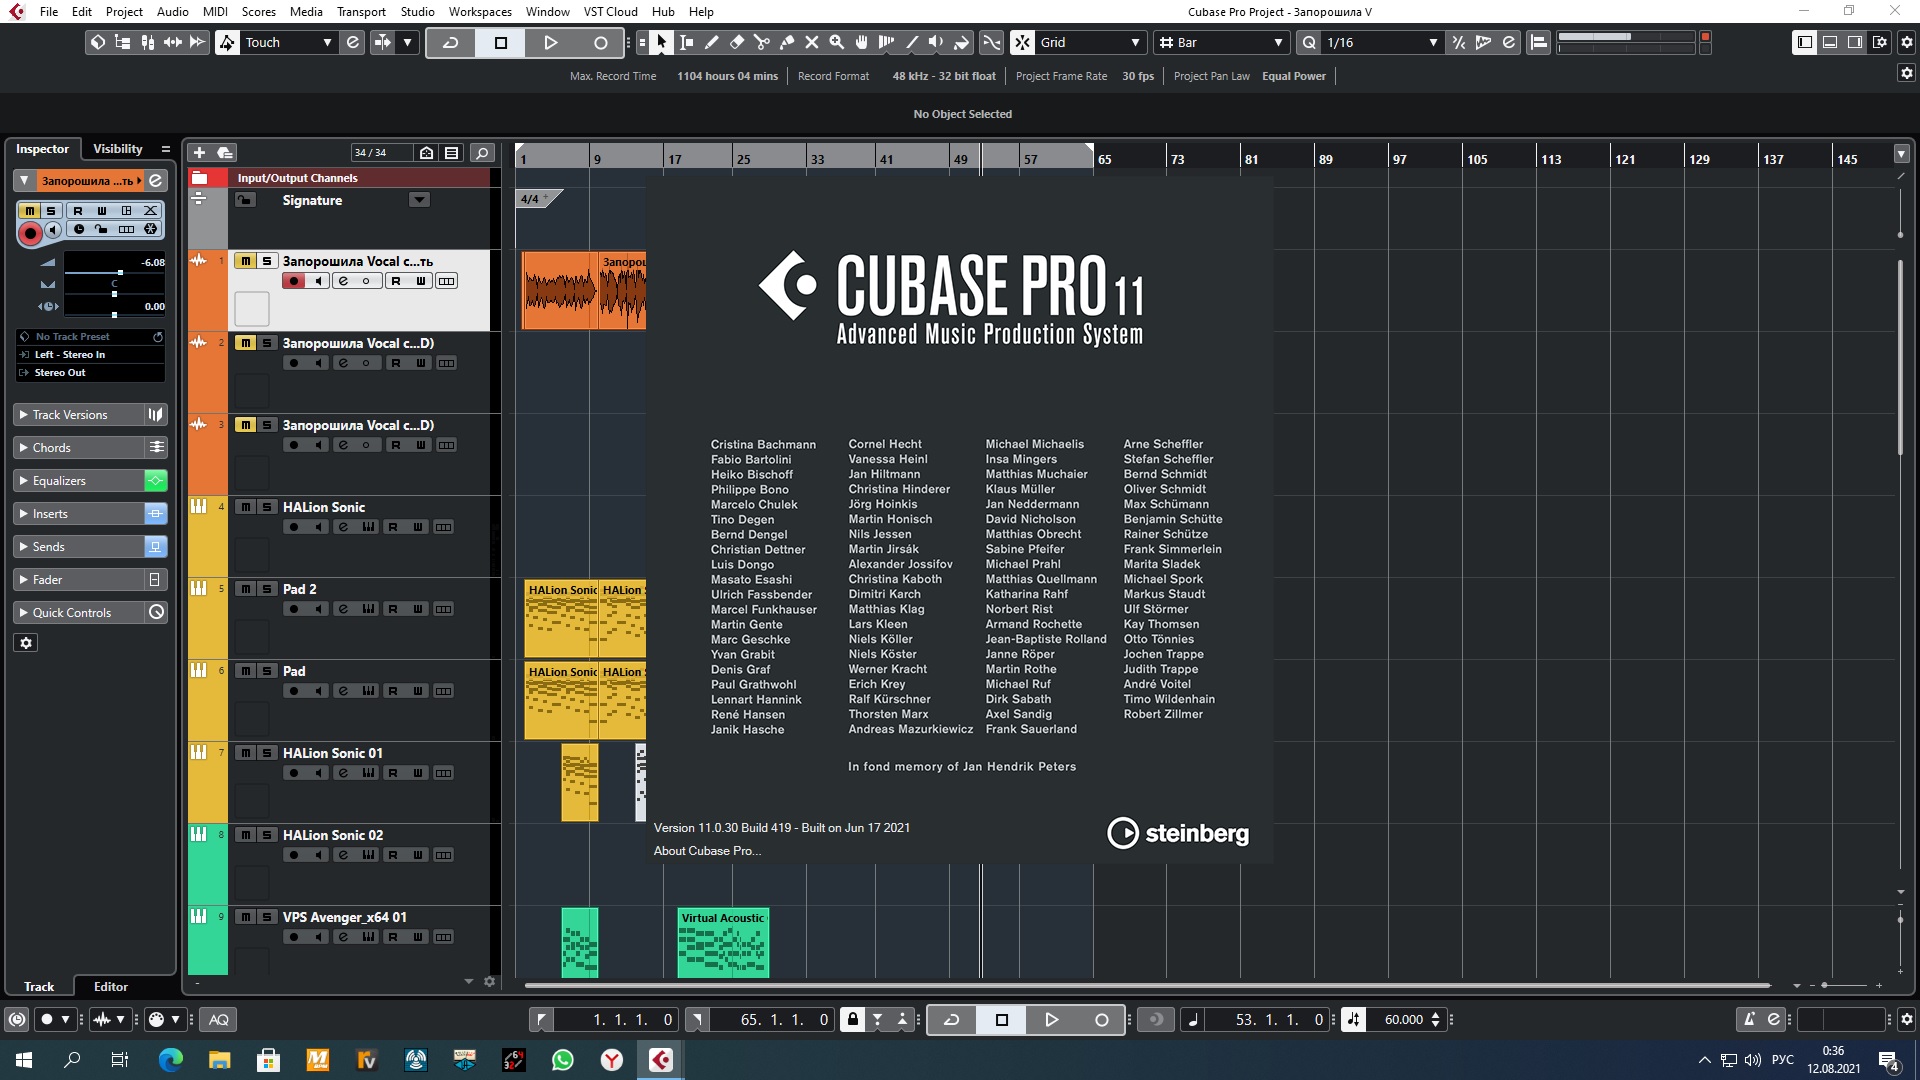
Hello everyone, I ran into such a problem, who knows how to solve this, or write on the site’s office (((why on the site’s site, because I bought a license 11, but it was in the elements, and in all versions I have, starting with cube 10, with which I worked ((((the essence of the problem is that when I do something, the loading indicator in my project) shows that the project is not too tight (((and the most important thing is that it happens that open it, galion sonic, and load there a piano with a pad that sounds good, and your kicker, the loading indicator jumps almost 90% atoms and 100% when you play (((although you understand that one sound is open, although in the task manager everything does not load even by 10%, (((the same bid in the project as in the photo, there are a lot of sample VSTs, but I understand that the percentage is just a quarter, it does not load with RAM, in the task manager (((, but the indicator shows everything in Cuba 11 almost to the eyeballs, this is on the intol process, well, at first I thought there might be a problem in it, but when I installed it at work that cube 11, there the hardware is much cooler, and more modern, namely AMD Ryzen 9 3900X plus RAM with a frequency of 3600, 64GB (((and the result is the same (((the loading indicator jumps almost 90% (((and clips the indicator in cube 11 (((is this a bug? Or have I configured something wrong in the cube? how you can work, it seems that there is nothing bursting, but the indicator somehow annoys, and when you go into the task manager, you generally understand that your lump is working half-heartedly, without straining)))
Welcome. And please, try to use paragraphs and sentences : according to Firefox research feature there is 0 dot and 33 commas in your post (and I won’t talk about the parenthesis)…
This said, I guess that the ‘loading indicator’ is actually the Audio Processing Load meter. It is normal that the values indicated here are higher than the CPU usage displayed in the task manager (I guess that you are using Windows…). They do not measure the same things : Cubase indicator also takes account of the real time processes occuring, mainly when using plug-ins for a given latency setting of your audio interface : the less latency, the more audio-processing load : it’s a trade-off. So, I would suspect few things :
- The latency setting of your audio interface (which is it ?) is set too low.
- Both systems (for different reasons) are not able to cope as they are with a normal audio/host application such as Cubase. This could be due to several things, the first ones I would think of are an incorrect setting of the USB ports, wi-fi adapter standing in the way, power management or any other adapter that takes too much real time processing resources.
- It could also be an unadaptated combination of Cubase settings : FWIW, and since a while, in the Studio>Studio Setup>Audio System pane, I have disabled both ASIO guard and Steinberg Audio power scheme, then kept the Audio priority to ‘Normal’. I never got better (low) audio processing load values, since, but YMMV : what is true for a given system might not be so for another one…
At the end, the first thing I would do is to make a kind of diagnostic concerning your system with the Latency monitor and report back here the results with a screenshot.
If your system is not up to the task, it will be time to look more closely at the different settings of your computer in the BIOS/UEFI and the adapters you are using on your system beside the audio ones.


I work in parallel in Pro Tools, everything is just fine there, if something shows the CPU load, or RAM, and hard disk, then everything is 100% correct there, and it is integrated with my system as one whole, so you always see how many resources you have left, and what you can do next!. Here I throw off a photo from Pro Tools of the full downloaded project. Russian Russian))), and we are used to communicate like this on Russian forums, I think you don’t need to pay attention to this))) here the most important thing is to understand the essence of the problem, and not to say that you did not put a point here))). Thank you again for the quick response.

I’m guessing these are an artifact of using a Cyrillic keyboard for English text.
@aan1982 Most Projects do ‘overload’ something while the Project is loading. It doesn’t indicate a real problem, just that a computer resource was 100% consumed during the loading process. Unfortunately the red indicator stays on until you click it to clear it. But after that if it goes on again while playing the Project - that is an issue because it will cause audio problems.
So if you clear the indicator, play your Project and it sounds fine and the indicator doesn’t get triggered again you are good.
Well, it wasn’t obvious seeing either the OP first post or his profile. But you’re probably right : so, my apologies to you, @aan1982.
Beside this, it indeed seems that your system isn’t the bottleneck, here. What I see also is that Cubase use just a little more CPU resources than ProTools, but I think that it could be explained by the FX/VSTis used : I’m not a ProTools specialist, far from it, but seeing the screenshot, it seems that all the tracks are audio ones in the project shown. These use much less resources than actual instrument tracks (with VSTis loaded) such as the ones you are using in your Cubase project (Halion Sonic, VPS Avenger…). This probably explain, at least partially, why you are getting a heavy audio processing load using it (which, again, isn’t equivalent to the CPU usage that Protools is displaying).
So, I would either use the Freeze instruments command for all your instrument tracks or use the different options of the Edit>Render in Place one for the same tracks and see how things are going from there. I guess that the audio processing load of your project will be much less after this…
Большое спасибо за ответ!)))
Thank you so much for the answer!)))