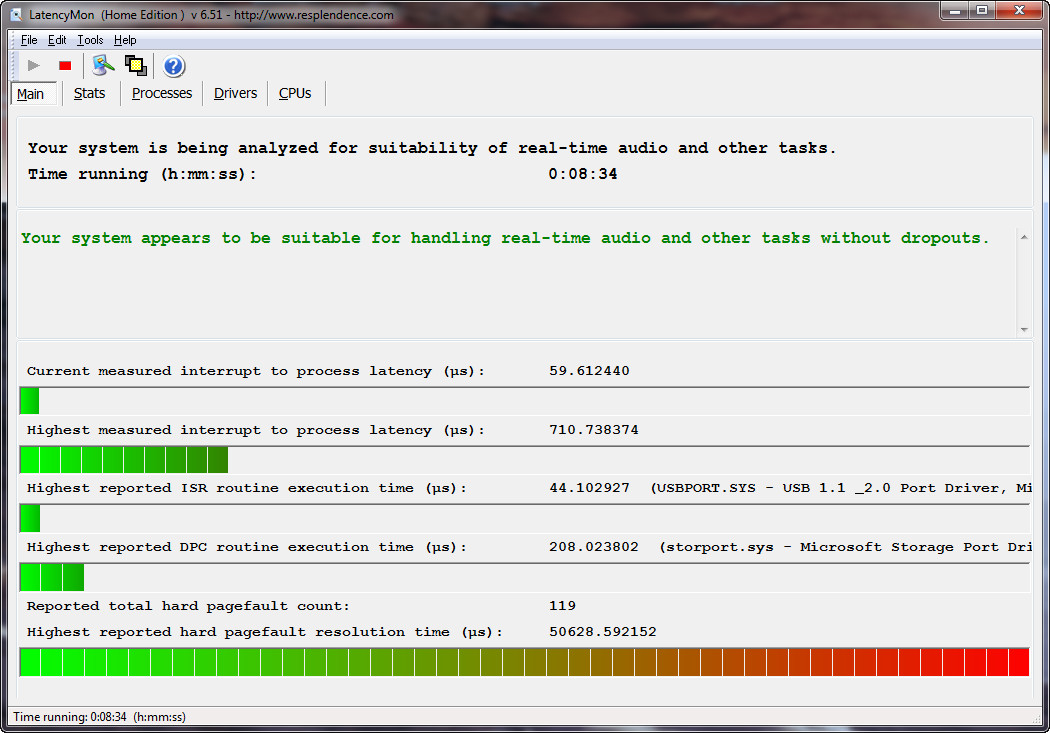
(The display did, however indicate “hard pagefaults” in the red). I neglected to get a screenshot at that time, but here’s a similar one I just took after running about 10 minutes:
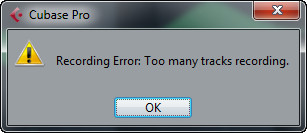
Audio dropouts continue to happen every few minutes, with the dreaded “Too Many Tracks Recording” showing up every hour or so.
So I left LatencyMon running overnight. In the morning the results were quite different:
I turned off all power management features a long time ago, but it made no difference.
I’m having trouble interpreting the results. Can anyone here help me?
CONCLUSION
Your system appears to be having trouble handling real-time audio and other tasks. You are likely to experience buffer underruns appearing as drop outs, clicks or pops. One or more DPC routines that belong to a driver running in your system appear to be executing for too long. One problem may be related to power management, disable CPU throttling settings in Control Panel and BIOS setup. Check for BIOS updates. LatencyMon has been analyzing your system for 19:12:58 (h:mm:ss) on all processors.
\
SYSTEM INFORMATION
Computer name: DRYCREEKDAW
OS version: Windows 7 Service Pack 1, 6.1, build: 7601 (x64)
Hardware: Z68A-D3H-B3, Gigabyte Technology Co., Ltd.
CPU: GenuineIntel Intel(R) Core™ i5-2400 CPU @ 3.10GHz
Logical processors: 4
Processor groups: 1
RAM: 16301 MB total
\
CPU SPEED
Reported CPU speed: 3109 MHz
Measured CPU speed: 1 MHz (approx.)
Note: reported execution times may be calculated based on a fixed reported CPU speed. Disable variable speed
settings like Intel Speed Step and AMD Cool N Quiet in the BIOS setup for more accurate results.
WARNING: the CPU speed that was measured is only a fraction of the CPU speed reported. Your CPUs may be throttled back due to variable speed settings and thermal issues. It is suggested that you run a utility which reports your actual CPU frequency and temperature.
\
MEASURED INTERRUPT TO USER PROCESS LATENCIES
The interrupt to process latency reflects the measured interval that a usermode process needed to respond to a hardware request from the moment the interrupt service routine started execution. This includes the scheduling and execution of a DPC routine, the signaling of an event and the waking up of a usermode thread from an idle wait state in response to that event.
Highest measured interrupt to process latency (µs): 6338.350329
Average measured interrupt to process latency (µs): 3.988367
Highest measured interrupt to DPC latency (µs): 781.548731
Average measured interrupt to DPC latency (µs): 0.821114
\
REPORTED ISRs
Interrupt service routines are routines installed by the OS and device drivers that execute in response to a hardware interrupt signal.
Highest ISR routine execution time (µs): 135.663557
Driver with highest ISR routine execution time: ACPI.sys - ACPI Driver for NT, Microsoft Corporation
Highest reported total ISR routine time (%): 0.124838
Driver with highest ISR total time: hal.dll - Hardware Abstraction Layer DLL, Microsoft
Corporation
Total time spent in ISRs (%) 0.128669
ISR count (execution time <250 µs): 72786378
ISR count (execution time 250-500 µs): 0
ISR count (execution time 500-999 µs): 0
ISR count (execution time 1000-1999 µs): 0
ISR count (execution time 2000-3999 µs): 0
ISR count (execution time >=4000 µs): 0
\
REPORTED DPCs
DPC routines are part of the interrupt servicing dispatch mechanism and disable the possibility for a process
to utilize the CPU while it is interrupted until the DPC has finished execution.
Highest DPC routine execution time (µs): 1557.360888
Driver with highest DPC routine execution time: storport.sys - Microsoft Storage Port Driver, Microsoft Corporation
Highest reported total DPC routine time (%): 0.054476
Driver with highest DPC total execution time: rspLLL64.sys - Resplendence Latency Monitoring and Auxiliary Kernel Library, Resplendence Software Projects Sp.
Total time spent in DPCs (%) 0.112580
DPC count (execution time <250 µs): 215787681
DPC count (execution time 250-500 µs): 0
DPC count (execution time 500-999 µs): 13
DPC count (execution time 1000-1999 µs): 2
DPC count (execution time 2000-3999 µs): 0
DPC count (execution time >=4000 µs): 0
\
REPORTED HARD PAGEFAULTS
Hard pagefaults are events that get triggered by making use of virtual memory that is not resident in RAM but backed by a memory mapped file on disk. The process of resolving the hard pagefault requires reading in the memory from disk while the process is interrupted and blocked from execution.
NOTE: some processes were hit by hard pagefaults. If these were programs producing audio, they are likely to interrupt the audio stream resulting in dropouts, clicks and pops. Check the Processes tab to see which programs were hit.
Process with highest pagefault count: msmpeng.exe
Total number of hard pagefaults 156794
Hard pagefault count of hardest hit process: 92986
Highest hard pagefault resolution time (µs): 7470285.403667
Total time spent in hard pagefaults (%): 0.075598
Number of processes hit: 21
\
PER CPU DATA
CPU 0 Interrupt cycle time (s): 1313.558937
CPU 0 ISR highest execution time (µs): 135.663557
CPU 0 ISR total execution time (s): 356.043880
CPU 0 ISR count: 72786378
CPU 0 DPC highest execution time (µs): 1557.360888
CPU 0 DPC total execution time (s): 288.244747
CPU 0 DPC count: 206681711
CPU 1 Interrupt cycle time (s): 207.017672
CPU 1 ISR highest execution time (µs): 0.0
CPU 1 ISR total execution time (s): 0.0
CPU 1 ISR count: 0
CPU 1 DPC highest execution time (µs): 212.599871
CPU 1 DPC total execution time (s): 3.309396
CPU 1 DPC count: 1143216
CPU 2 Interrupt cycle time (s): 2247.746407
CPU 2 ISR highest execution time (µs): 0.0
CPU 2 ISR total execution time (s): 0.0
CPU 2 ISR count: 0
CPU 2 DPC highest execution time (µs): 179.325507
CPU 2 DPC total execution time (s): 9.259974
CPU 2 DPC count: 3407636
CPU 3 Interrupt cycle time (s): 902.550271
CPU 3 ISR highest execution time (µs): 0.0
CPU 3 ISR total execution time (s): 0.0
CPU 3 ISR count: 0
CPU 3 DPC highest execution time (µs): 227.354455
CPU 3 DPC total execution time (s): 10.708577
CPU 3 DPC count: 4555133