Thx for the overview.
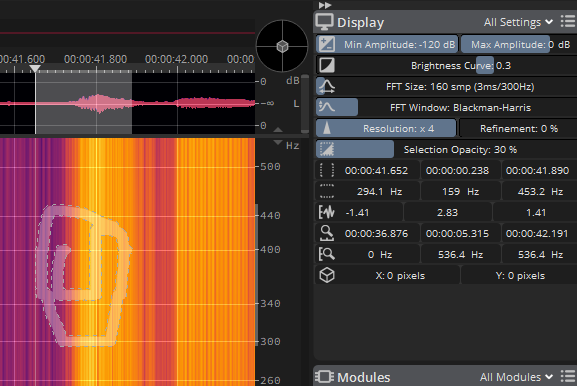
It’s a very good question to ask of how the pixels on the screen at some resolution correspond to the actual acoustic data.
Just imagine one selects some points and than changes the FFT-size or the resolution. How does this effects the actual acoustical datapoints?
See here for instance:
Not forget about the fancy 3D-view… any real good usecase for this?
When selecing datapoints in the 3D-view and moving the viewpoint, are we still selecting the same datapoints?
[image]
[image]
Sure, do you have an emailadress to send this via “wetransfer”?
But you can also create your own example:
Use an (original) soundfile, import it into Spectral Layers
Unmix Components (Tonal, Transient, Noise)
Export the three files (Tonal, Transient, Noise)
Start “Audacity”
Load the original soundfile into Audacity
Also load the three files (Tonal, Transient, Noise) into Audacity
Invert the original Soundfile
Save all four tracks into one file. This should be completely silent.
Reload this on…
The unmixed Layers do not add up to the original.
Here is an example
[image]
Take a song and unmix it
Than save all layers seperately
Load the original song in (for instance) Audacity or Wavelab
invert the original song
add the three unmixed layers (Vocals, Drums and Other)
Than add all four tracks (“inverted original”, “Vocals”, “Drums” and “Other”) and save this file “residuum.wav”
load the file “residuum.wav” and normalize it in order to see (and hear), what has been left.
→ residuum.w…
I wonder how an actual good usecase for the display feature “Refinement” would be.
Without Refinement:
[image]
With Refinement:
[image]
“Hm, ok”, but what is the actual benefit of this? I don’t get it… Looks like a pretty Cheetah. But how to use it for practical purposes?
[image]
It would be useful to have more information along the line and in the particular spectrum along the line.
For instance: For the frequencies and the dB some numbers along the coordinate system would be very helpful here.
[image]
When selecting a large number of datapoints, the Magic Wand-Selectiontool becomes slower and slower, until it is not usable for practical purposes.
The speed of selection should be (almost) independent of already selected datapoints.
[image]
(Btw. in this picture, we see a certain visual contrast enhancement. And then afterwards trying to select certain datapoints. With contrast enhancement on the fft-datapoints, this would not be necessary, though…)
The statistical information about the spectrum should have more detail information in a clear table-presentation.
Here, for instance, I would like to find the maximum db-value of the whole spectrum. How to find this?
[image]
Is there a way to makr this datapoint(s) of maximum value?
This is hard to read
[image]
ah, ok, this is the maximum db of the selction, I guess.
[image]
I do love the concept of SL and consider as one of those great ingenious programs, that combine art and usability. But the actual code base and implementation of SL seems to need some deep refinement on a very fundamental level.
I might be a bit sarcastic… sorry