Yes, I have been using that but it’s not really helped so far in resolving the problem…
I’ve had different results… sometimes storport.sys and ndis.sys are highlighted as high DPC latency, but it is only sometimes.
Today, I ran latency test 3 times so far, and no high DPC latency was reported… I pasted the results below.
But the C8 problem is there all the time.
I use AVG but I completely uninstalled that and it made no difference. I’ve uninstalled the MIDI controller and that made no difference. Same with firewire card.
This is dominating my days now, it’s madness.
CONCLUSION
Your system appears to be suitable for handling real-time audio and other tasks without dropouts.
LatencyMon has been analyzing your system for 0:11:38 (h:mm:ss) on all processors.
\
SYSTEM INFORMATION
Computer name: DARRENBROCK-PC
OS version: Windows 7 Service Pack 1, 6.1, build: 7601 (x64)
Hardware: All Series, ASUS, ASUSTeK COMPUTER INC., Z87-A
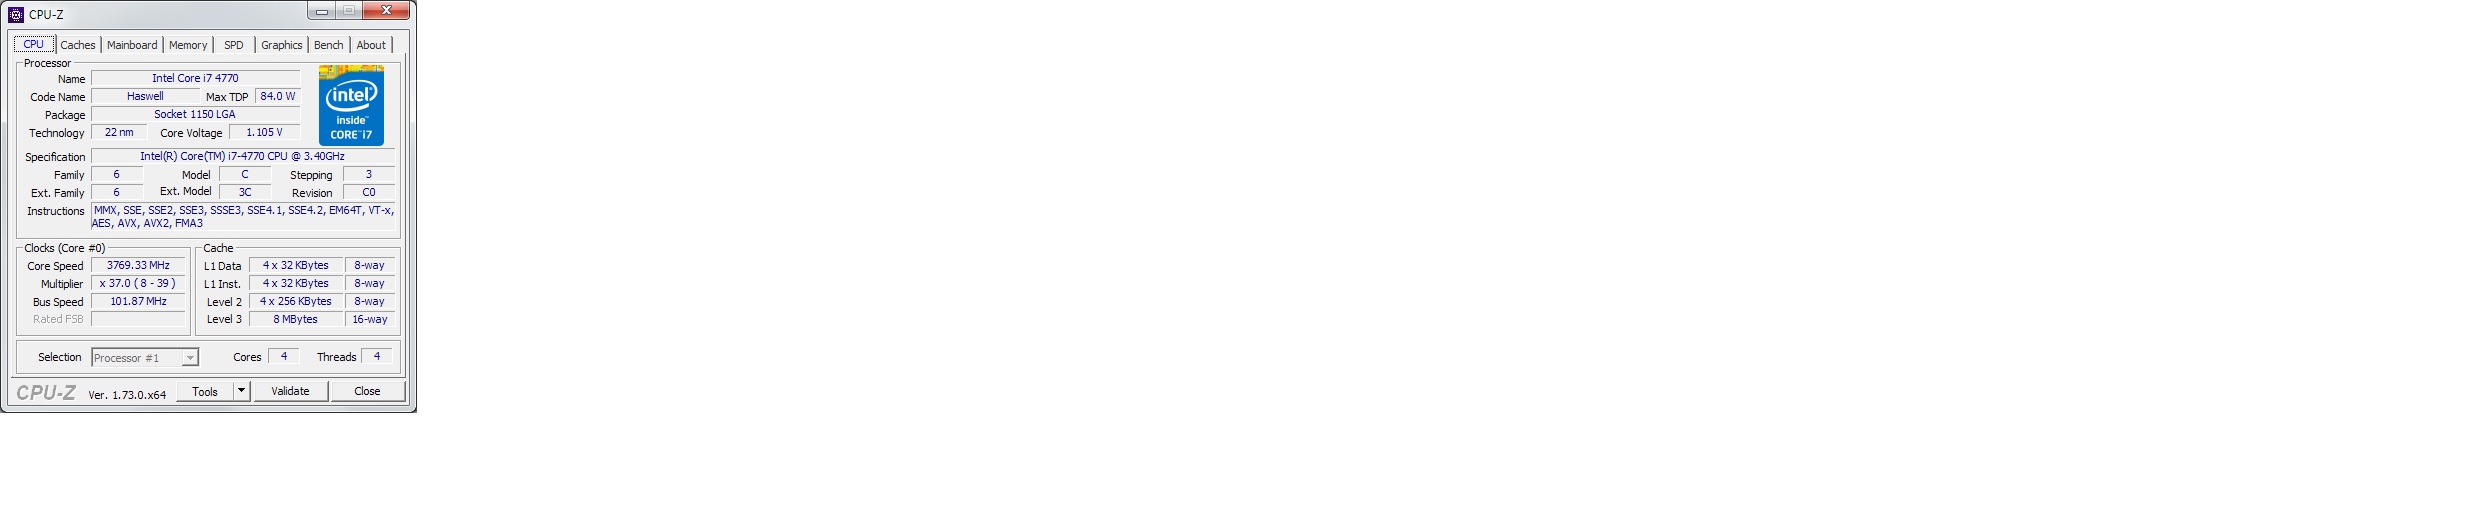
CPU: GenuineIntel Intel(R) Core™ i7-4770 CPU @ 3.40GHz
Logical processors: 4
Processor groups: 1
RAM: 32191 MB total
\
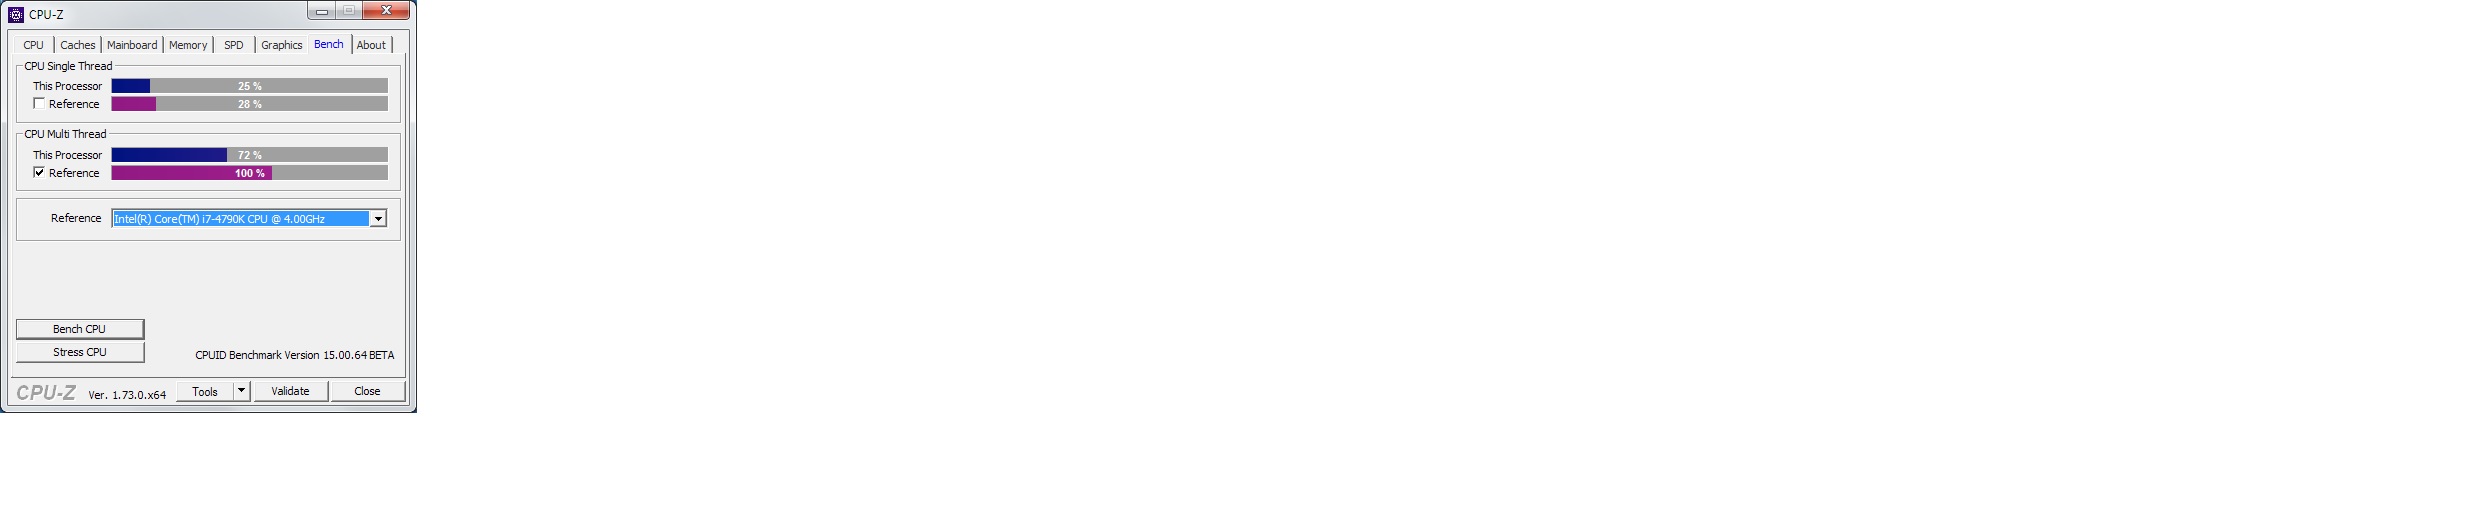
CPU SPEED
Reported CPU speed: 340 MHz
Measured CPU speed: 1 MHz (approx.)
Note: reported execution times may be calculated based on a fixed reported CPU speed. Disable variable speed settings like Intel Speed Step and AMD Cool N Quiet in the BIOS setup for more accurate results.
WARNING: the CPU speed that was measured is only a fraction of the CPU speed reported. Your CPUs may be throttled back due to variable speed settings and thermal issues. It is suggested that you run a utility which reports your actual CPU frequency and temperature.
\
MEASURED INTERRUPT TO DPC LATENCIES
The interrupt to DPC latency reflects the measured interval in which a DPC could execute in response to a hardware request from the moment the interrupt service routine started execution.
Highest measured interrupt to DPC latency (µs): 48.789876
Average measured interrupt to DPC latency (µs): 1.649448
\
REPORTED ISRs
Interrupt service routines are routines installed by the OS and device drivers that execute in response to a hardware interrupt signal.
Highest ISR routine execution time (µs): 11.195588
Driver with highest ISR routine execution time: Wdf01000.sys - Kernel Mode Driver Framework Runtime, Microsoft Corporation
Highest reported total ISR routine time (%): 0.070254
Driver with highest ISR total time: Wdf01000.sys - Kernel Mode Driver Framework Runtime, Microsoft Corporation
Total time spent in ISRs (%) 0.070901
ISR count (execution time <250 µs): 651896
ISR count (execution time 250-500 µs): 0
ISR count (execution time 500-999 µs): 0
ISR count (execution time 1000-1999 µs): 0
ISR count (execution time 2000-3999 µs): 0
ISR count (execution time >=4000 µs): 0
\
REPORTED DPCs
DPC routines are part of the interrupt servicing dispatch mechanism and disable the possibility for a process to utilize the CPU while it is interrupted until the DPC has finished execution.
Highest DPC routine execution time (µs): 104.260588
Driver with highest DPC routine execution time: ndis.sys - NDIS 6.20 driver, Microsoft Corporation
Highest reported total DPC routine time (%): 0.426423
Driver with highest DPC total execution time: Wdf01000.sys - Kernel Mode Driver Framework Runtime, Microsoft Corporation
Total time spent in DPCs (%) 0.442706
DPC count (execution time <250 µs): 1087357
DPC count (execution time 250-500 µs): 0
DPC count (execution time 500-999 µs): 0
DPC count (execution time 1000-1999 µs): 0
DPC count (execution time 2000-3999 µs): 0
DPC count (execution time >=4000 µs): 0
\
REPORTED HARD PAGEFAULTS
Hard pagefaults are events that get triggered by making use of virtual memory that is not resident in RAM but backed by a memory mapped file on disk. The process of resolving the hard pagefault requires reading in the memory from disk while the process is interrupted and blocked from execution.
NOTE: some processes were hit by hard pagefaults. If these were programs producing audio, they are likely to interrupt the audio stream resulting in dropouts, clicks and pops. Check the Processes tab to see which programs were hit.
Process with highest pagefault count: explorer.exe
Total number of hard pagefaults 30
Hard pagefault count of hardest hit process: 23
Highest hard pagefault resolution time (µs): 196138.127059
Total time spent in hard pagefaults (%): 0.010806
Number of processes hit: 3
\
PER CPU DATA
CPU 0 Interrupt cycle time (s): 14.444593
CPU 0 ISR highest execution time (µs): 11.195588
CPU 0 ISR total execution time (s): 1.981885
CPU 0 ISR count: 651896
CPU 0 DPC highest execution time (µs): 76.255294
CPU 0 DPC total execution time (s): 12.230661
CPU 0 DPC count: 938202
CPU 1 Interrupt cycle time (s): 0.222928
CPU 1 ISR highest execution time (µs): 0.0
CPU 1 ISR total execution time (s): 0.0
CPU 1 ISR count: 0
CPU 1 DPC highest execution time (µs): 104.260588
CPU 1 DPC total execution time (s): 0.052185
CPU 1 DPC count: 47078
CPU 2 Interrupt cycle time (s): 0.179676
CPU 2 ISR highest execution time (µs): 0.0
CPU 2 ISR total execution time (s): 0.0
CPU 2 ISR count: 0
CPU 2 DPC highest execution time (µs): 55.865882
CPU 2 DPC total execution time (s): 0.034850
CPU 2 DPC count: 33945
CPU 3 Interrupt cycle time (s): 0.201887
CPU 3 ISR highest execution time (µs): 0.0
CPU 3 ISR total execution time (s): 0.0
CPU 3 ISR count: 0
CPU 3 DPC highest execution time (µs): 102.719118
CPU 3 DPC total execution time (s): 0.057201
CPU 3 DPC count: 68132