How to analyse Cubase crash dumps on Windows

Since this came up recently, I decided to write a little tutorial on how to analyze Cubase Crash dumps on Windows 10 (and probably 11, too). This can be helpful if you want to find out if it is a specific plugin that is the culprit for the crash.
Before you do that, have a look at the windows event log, though, sometimes there is an error message in the Windows->Application section that says something like “The Application Cubase crashed in the module ‘WaveShell1-VST 10.0_x64.dll’”. Then you know the problem dll already.

DISCLAIMER: I don’t claim to be an expert in debugging binary programs. This is just what I taught myself to get to the bottom of some Cubase crashes. If in doubt, better upload the crash dump here in a post and let good old Martin Jirsak do his work!

Download the “WinDbg Preview”-App from the Microsoft Store (Microsoft Apps), start it and from the File menu, select “Start Debugging” and “Open Dump File”. Then browse to the Crashdump directory in “Documents\Steinberg\Crashdumps” and open the dmp file.
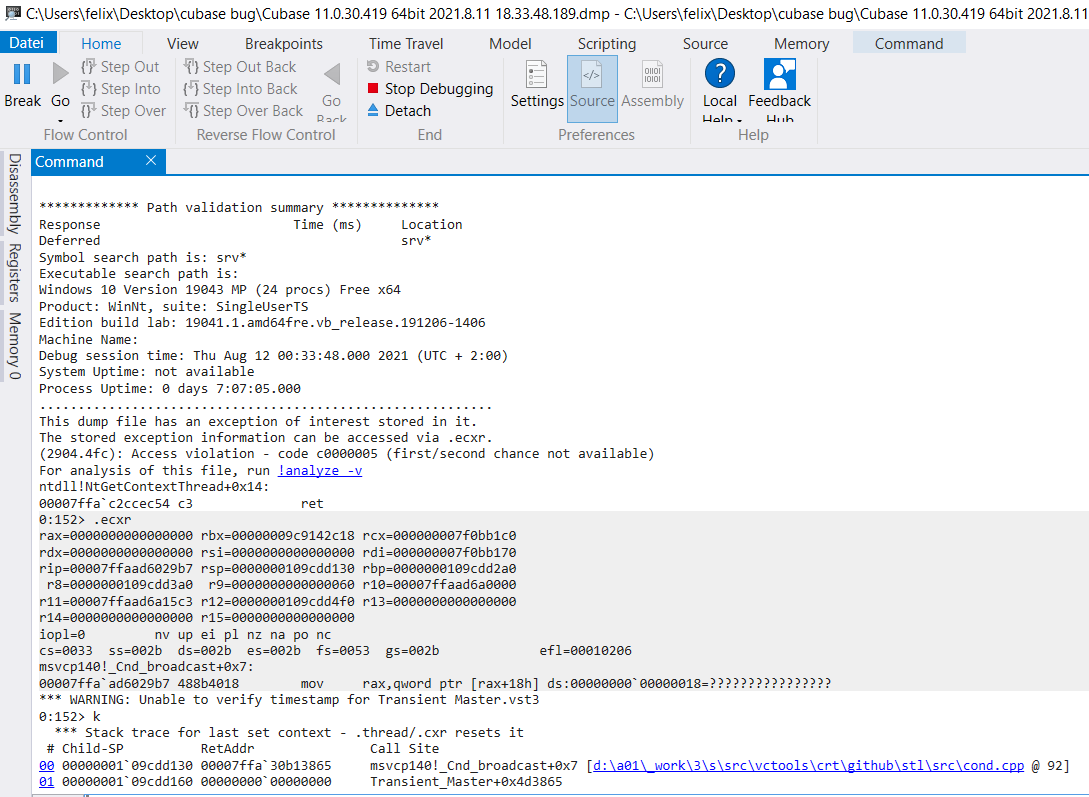
In the command line of the “Command” window, type “.ecxr” and “k”, this will show the stack trace of the module that crashed:

At the bottom of the screenshot you see the Name “Transient_Master”. This is the name of the plugin that most likely crashed. If you don’t see the name of any plugin in the stack trace, the crash probably happened somewhere in Cubase itself.

30 Likes

A couple of years ago, I encountered the dreaded “Cubase hang on project close” problem. The culprit is usually a plugin. But how to find out? In this case, start WinDbg, but Select “File->Attach to Process” and then select Cubase. Do this when you already closed the project and Cubase hangs. Now just type “k” in the command window. You then get a stack trace, which can be really long. In there, search for a plugin name that you used in the project. Most likely, this is the culprit for the hang.


  0  Id: 1330.2120 Suspend: 1 Teb: 00000000`002af000 Unfrozen
 # Child-SP          RetAddr           Call Site
00 00000000`0014e6c8 00007ffc`080a9252 ntdll!NtWaitForSingleObject+0x14
01 00000000`0014e6d0 00007ffb`c8bc8c7d KERNELBASE!WaitForSingleObjectEx+0xa2
02 00000000`0014e770 00007ffb`c891e576 D3D10Warp!ThreadPool::WaitWhileBusy+0xdd
03 00000000`0014e7f0 00007ffb`c88f307d D3D10Warp!UMContext::FlushAllRenderingTasks+0xfc6
04 00000000`0014f090 00007ffc`04f61451 D3D10Warp!UMDevice::DestroyResource+0x44d
05 00000000`0014f160 00007ffc`04f60b05 d3d11!CResource<ID3D11Buffer>::CLS::FinalRelease+0x71
06 00000000`0014f190 00007ffc`04f7c34c d3d11!TCLSWrappers<CBuffer>::CLSDestroy+0x15
07 00000000`0014f1c0 00007ffc`04f7c2f9 d3d11!CLayeredObjectWithCLS<CBuffer>::~CLayeredObjectWithCLS<CBuffer>+0x24
08 00000000`0014f1f0 00007ffc`04f7d17a d3d11!CLayeredObjectWithCLS<CBuffer>::Release+0x9
09 00000000`0014f220 00007ffc`04f6771f d3d11!NDXGI::CDeviceChild<IDXGIResource1,IDXGISwapChainInternal>::FinalRelease+0x12a
0a 00000000`0014f260 00007ffc`04f68279 d3d11!CUseCountedObject<NOutermost::CDeviceChild>::UCDestroy+0x27f
0b 00000000`0014f290 00007ffc`04f7e29b d3d11!NOutermost::CDevice::FlushDeletionPool+0x369
0c 00000000`0014f320 00007ffc`04f6b100 d3d11!CDevice::LLOBeginLayerDestruction+0x10f
0d 00000000`0014f350 00007ffc`04f67ef5 d3d11!NDXGI::CDevice::LLOBeginLayerDestruction+0x10c
0e 00000000`0014f3a0 00007ffc`04f67dab d3d11!NOutermost::CDevice::LLOBeginLayerDestruction+0x25
0f 00000000`0014f3d0 00007ffc`04f67cf4 d3d11!TComObject<NOutermost::CDevice>::~TComObject<NOutermost::CDevice>+0x23
10 00000000`0014f400 00007ffc`04f67d74 d3d11!TComObject<NOutermost::CDevice>::`scalar deleting destructor'+0x14
11 00000000`0014f430 00007ffc`04fa84bb d3d11!TComObject<NOutermost::CDevice>::Release+0x44
12 00000000`0014f460 00007ffc`04f64934 d3d11!ATL::CComPtr<IUnknown>::~CComPtr<IUnknown>+0x4b
13 00000000`0014f4a0 00007ffc`05327735 d3d11!CLayeredObjectWithCLS<CBuffer>::CContainedObject::Release+0x2c4
14 00000000`0014f4f0 00007ffc`0535f929 d2d1!CHwSurfaceRenderTargetSharedData::~CHwSurfaceRenderTargetSharedData+0x1f5
15 00000000`0014f520 00007ffc`0535f9d7 d2d1!InitializableObject<RefCountedObject<CD3DDeviceLevel1,LockingRequired,DeleteOnZeroReference> >::`vector deleting destructor'+0x29
16 00000000`0014f550 00007ffc`0535fead d2d1!RefCountedObject<CD3DDeviceLevel1,LockingRequired,DeleteOnZeroReference>::Release+0x47
17 00000000`0014f580 00007ffc`0535e7c9 d2d1!CD3DDeviceManager::D3DDeviceInformation::`scalar deleting destructor'+0x2d
18 00000000`0014f5b0 00007ffc`052bfb34 d2d1!CD3DDeviceManager::~CD3DDeviceManager+0x71
19 00000000`0014f5e0 00007ffc`05300a00 d2d1!D2DFactory::~D2DFactory+0xbc
1a 00000000`0014f620 00007ffc`053009e9 d2d1!RefCountedObject<D2DFactoryLocking<MultiThreadedTrait>,LockingRequired,DeleteOnZeroReference>::`vector deleting destructor'+0x14
*** WARNING: Unable to verify checksum for C:\Program Files\Vstplugins\ToneBoosters\TrackEssentials_v3\TB_Compressor_v3.dll
*** ERROR: Symbol file could not be found.  Defaulted to export symbols for C:\Program Files\Vstplugins\ToneBoosters\TrackEssentials_v3\TB_Compressor_v3.dll - 
1b 00000000`0014f650 00007ffb`bb104c7a d2d1!RefCountedObject<D2DFactoryLocking<MultiThreadedTrait>,LockingRequired,DeleteOnZeroReference>::Release+0x39
1c 00000000`0014f680 00007ffc`08401243 TB_Compressor_v3!VSTPluginMain+0x4390a
1d 00000000`0014f6c0 00007ffc`08401017 ucrtbase!<lambda_f03950bc5685219e0bcd2087efbe011e>::operator()+0xc3
1e 00000000`0014f720 00007ffc`08400fd4 ucrtbase!__crt_seh_guarded_call<int>::operator()<<lambda_7777bce6b2f8c936911f934f8298dc43>,<lambda_f03950bc5685219e0bcd2087efbe011e> & __ptr64,<lambda_3883c3dff614d5e0c5f61bb1ac94921c> >+0x3b
1f 00000000`0014f750 00007ffb`bb127bae ucrtbase!execute_onexit_table+0x34
20 00000000`0014f780 00007ffb`bb127cac TB_Compressor_v3!VSTPluginMain+0x6683e
21 00000000`0014f7b0 00007ffc`0b9c4063 TB_Compressor_v3!VSTPluginMain+0x6693c
22 00000000`0014f810 00007ffc`0b9cff81 ntdll!LdrpCallInitRoutine+0x6b
23 00000000`0014f880 00007ffc`0b9cf5ae ntdll!LdrpProcessDetachNode+0xf5
24 00000000`0014f950 00007ffc`0b9cf955 ntdll!LdrpUnloadNode+0x3e
25 00000000`0014f9a0 00007ffc`0b9cf8d3 ntdll!LdrpDecrementModuleLoadCountEx+0x71
26 00000000`0014f9d0 00007ffc`0808bced ntdll!LdrUnloadDll+0x93
*** WARNING: Unable to verify checksum for C:\Program Files\Steinberg\Cubase 9.5\Components\VSTPlugManager.dll
*** ERROR: Symbol file could not be found.  Defaulted to export symbols for C:\Program Files\Steinberg\Cubase 9.5\Components\VSTPlugManager.dll - 
27 00000000`0014fa00 00000000`155b6f4a KERNELBASE!FreeLibrary+0x1d
28 00000000`0014fa30 00000000`155b803c VSTPlugManager!InitDll+0x330fb
29 00000000`0014fa70 00000000`155b0105 VSTPlugManager!InitDll+0x341ed
2a 00000000`0014faa0 00007ffc`0b37786d VSTPlugManager!InitDll+0x2c2b6
2b 00000000`0014fad0 00007ffc`0b3767f8 USER32!UserCallWinProc+0x25d
*** ERROR: Module load completed but symbols could not be loaded for C:\Program Files\Steinberg\Cubase 9.5\Cubase9.5.exe
2c 00000000`0014fc50 00000001`41bf910d USER32!DispatchMessageWorker+0x2a8
2d 00000000`0014fce0 00000001`41dbf51d Cubase9_5+0x1bf910d
2e 00000000`0014fd10 00000001`41dbf459 Cubase9_5+0x1dbf51d
2f 00000000`0014fd40 00000001`41be441c Cubase9_5+0x1dbf459
30 00000000`0014fd70 00000001`419488c4 Cubase9_5+0x1be441c
31 00000000`0014fda0 00000001`41947f51 Cubase9_5+0x19488c4
32 00000000`0014fde0 00000001`4194b60f Cubase9_5+0x1947f51
33 00000000`0014fee0 00000001`41efe022 Cubase9_5+0x194b60f
34 00000000`0014ff20 00007ffc`0b2b3034 Cubase9_5+0x1efe022
35 00000000`0014ff60 00007ffc`0ba01471 KERNEL32!BaseThreadInitThunk+0x14
36 00000000`0014ff90 00000000`00000000 ntdll!RtlUserThreadStart+0x21

(This is an old excerpt from C9.5 . The problem was the TB_Compressor_V3 plugin, which was built with an older version of the VSTGUI SDK which contained a bug. The dev switched to a newer version and the problem was gone. )

13 Likes

Just came across this thread through your sig,

This deserves a thanks reply at least. Always wanted to know how to do this!

3 Likes

Addendum:
In Windbg Preview, you can also simply click on the blue “analyze -v” text in the window:

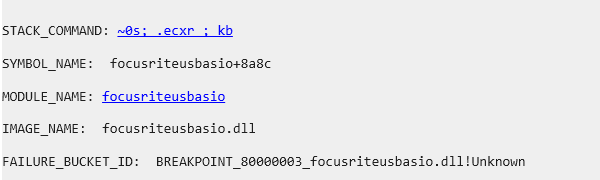
Windbg then analyzes the dump and spits out a lot of text, most of which is not relevant for us, but if you check the section around “MODULE_NAME”, it can give you a hint in which DLL the problem happened, for example:

Here, the exception happened in the WavesLib1_14_0_83_Win64.dll, which is probably related to Waves plugins.

4 Likes

ECXR K. Without the period. Is not giving me the next information

I think that’s indeed ‘outdated’ info.
Just let that ‘analyze’ function run and if an ‘interesting exception’ is found, it will show at least which plug-in is to blame

Ok thanks

It’s not outdated info, it works in WinDBG Preview just as it worked in old WinDBG, and gives you pretty much the same result.
It is of course simpler to just click on the “!analyze -v” text.

1 Like

I just wanted to thank you for putting this up. I analyzed the crashdump. For me it was Komplete Kontrol. I reinstalled it and it seems to be working now. Thanks again so much. This was driving me insane.

Second that. Many thanks.

Oh yes! For me it was “Cher” :wink:
Thanks!! Easiest way by far!

Great “Hint” !!! THX

That helps a lot to self debug bad plugins and remove them.

Thanks a lot!

Hello, can anyone help analyzing a dmp file ? I followed instructions, no vst is shown

Hi,
I followed instructions from fese and I managed to open the CrushDump once , but when I wanted to open other dmp file (after WinDbg restart) it stopped to read dmp files, Now everytime
I want to open any dmp file I have nothing but this


What do I do wrong?

Anybody could help?

View > Command

Post it here.

Thanks a lot!!! Problem solved:-)